
.svg)
There are few phenomena that are as complex as interpersonal communication and collaboration. Even when interacting with just one person, due to our personal theories of others’ minds the complexities of our interplay can be sometimes hard to understand and resolve, as the cartoon in Fig. 1 below humorously illustrates.

Fig. 1: The human mind, in comparison with other animals’ minds, has a well developed ability to model mental states (perceptions, wishes, emotions, beliefs, etc.) of other members of the group. This ability of ours deploys the power of the recursive thinking that enables people to model in their minds even very complex social situations, similar to the one depicted in the cartoon above. Another example of this ability in action would be the following reflection: “George thinks Joan is afraid that John has too little respect for the situation, and that his opponents will be able to take advantage of it.” That corresponds to 3 so-called levels of intentionality. According to Kinderman et al. (1998), we can keep track of about five levels of intentionality. This is consistent with what we know about the limited capacity of our short-term memory (George Miller's "Magical Number Seven, Plus or Minus Two") and the capacity of working memory (4 or 5 items). (The cartoon is from Bruce Eric Kaplan who published it in New Yorker (1998, October 24)).
To put measure on these complexities, we can apply the Metcalfe’s law to the social environments we live in. According to this rule, originally formulated for the world of electronic communication devices, the number of possible connections between people is proportional to the square of the number of connected people. From 3 people with only 3 possible connections, it increases quickly through 5, 7 and 9 people to 10, 21 and 36 connections, respectively. With a group of 35 people, corresponding by its size to a smaller department, we jump to astounding 595 possible connections.

Fig. 2: According to Metcalfe’s law the number of possible connections between a network of interconnected nodes is equal to n(n-1)/2, where n is the number of nodes (e.g. people in a social group). The image displays networks with 3, 5, 7 and 9 nodes, respectively, and with corresponding 3, 10, 21 and 36 possible connections between them, respectively. (The picture is from Michael Ruffus’ blog post about Metcalfe's Law.)
Because our professional success and our well-being depends on our ability to keep track not only of our direct connections, but also of the connections between others, such huge numbers of connections represents a real challenge for our social brains. Think of the effort it takes to successfully maneuver office politics in your company, or the delicate balance required in handling any strained relationships between members of your wider family.
The need to better understand, predict, and also shape the behavior of such complex social systems inspired the method of Sociomapping.
Visualizing where you are and where to go
Before diving into a more detailed and slightly technical introduction to the Sociomapping method, let’s illustrate its basic idea with one metaphorical example.
Imagine that you are a salesman and that you are about to plan a business trip around popular destinations within Queensland in Australia. You want to spend as little time on the road as possible, so you need to choose the order in which you will visit the cities carefully. Unfortunately, you were provided only with a table containing information about the distances in kilometres between each destination (see table in Fig. 3). Equipped with this table alone, it would be very difficult for you to figure out what would be the best route. Fortunately, it is possible to re-represent numerical information in the table as a map. With a map at hand the original problem becomes much easier to resolve: you can now rely on your intuitive and effortless ability to detect and comprehend even very complex spatial patterns and regularities.


Fig. 3: The table at the top shows distances in kilometres between various popular destinations within Queensland in Australia (Brisbane, Bundaberg, Cairns, Coolangatta, Hervey Bay, Mackay, Maroochydore, Mission Beach, Noosa, Port Douglas, Rockhampton, Surfers Paradise, Toowoomba and Townsville). At the map at the bottom there is the very same numerical information presented in a much more user-friendly, spatial way. Such representation of information enables one to solve her problem of finding the shortest path between selected destinations much more easily.
Imagine that you were to have a similar map to navigate your social environment. Luckily, you do not have to imagine it. Sociomapping does exactly that. It translates information about interpersonal relationships into spatial information and deploys our innate ability to effectively process vast amounts of visual information for decoding useful insights about our social environments and finding routes to our goals.
What is Sociomapping?
The core algorithm behind Sociomapping takes a matrix of relationship weights as an input and outputs 2D coordinates of the people (or any other object, for that matter), such that the distance between objects at the 2D placement corresponds, best as it could, to the weights in the input matrix. For example, if Alice has a strong relationship with Bob (and vice versa) and a weak relationship with Clark, she would appear closer to Bob than to Clark in the 2D model - the Sociomap.
The exact algorithm is based on work of Radvan Bahbouh and Cyril Hoschl, the CTO of Time is Ltd. While we don’t need to delve into details, it is worth noting that it is essentially a dimensionality reduction algorithm and the resulting “image”, therefore, distorts the original data a little bit. Just like the map of the Earth is distorted when printed on a 2D surface (there are many projections, each distorting the true distances on Earth in one way or another), so the Sociomap may not represent all relations with 100% accuracy. However, the distortion is usually very low and the benefit of easier comprehension of the relations via spatial representation is considerable.
In the last step, the 2D model is enriched with a third dimension, the height, which can convey any metric pertaining to the object, e.g. number of hours the person / department spent in meetings. The resulting 3D model is rendered visually so as to resemble a landscape, color-coding heights for better read.
Improving human interactions with the help of math
The first and original use case for Sociomapping is as an aid to better team communication and collaboration. The Sociomap here serves as a common “source of truth” for teams that want to improve the efficiency of their communication and collaboration, abetting a method of continuous discussion and implementation of small adjustments to how members work together.
Sociomapping thus fits very naturally into the coaching process described by the well-known GROW model of coaching (Whitmore, 1988) that enables people and teams to achieve their goals through systematic “confrontation” of these goals with their current reality and experimentation with possible actions that will bring them closer to their goals.

Fig. 4: The GROW model represents one of the most popular coaching frameworks that enables individuals to implement changes in their lives that will bring them closer to their goals. The logic behind this model can be applied effectively also to teams and departments.
For this specific use case, active data are usually used for computation of the Sociomaps. This means that the team members are asked a few questions in a short survey about their personal experiences of communicating and collaborating with other people in their team. For example, “Rate each member of your team by how often you communicate on work topics.” or “Please rate how available each team member is for you to deal with work-related issues.”.
The questions being asked can be customized for individual teams based on the three following considerations:
- What kind of a problem the team is dealing with?
E.g. communication, team atmosphere, knowledge management, team reorganization, decision making and strategy, etc. - What kind of team is it?
We can use, for example, Sundstrom, De Meuse and Futrell’s (1990) team typology that classifies teams into Advice/Involvement, Production/Service, Project/Development and Action/Negotiation team categories. - In which stage of development is the team?
The Tuckman’s (1965) team-development model that classifies teams into Forming, Storming, Norming and Performing stages of development could be used here.
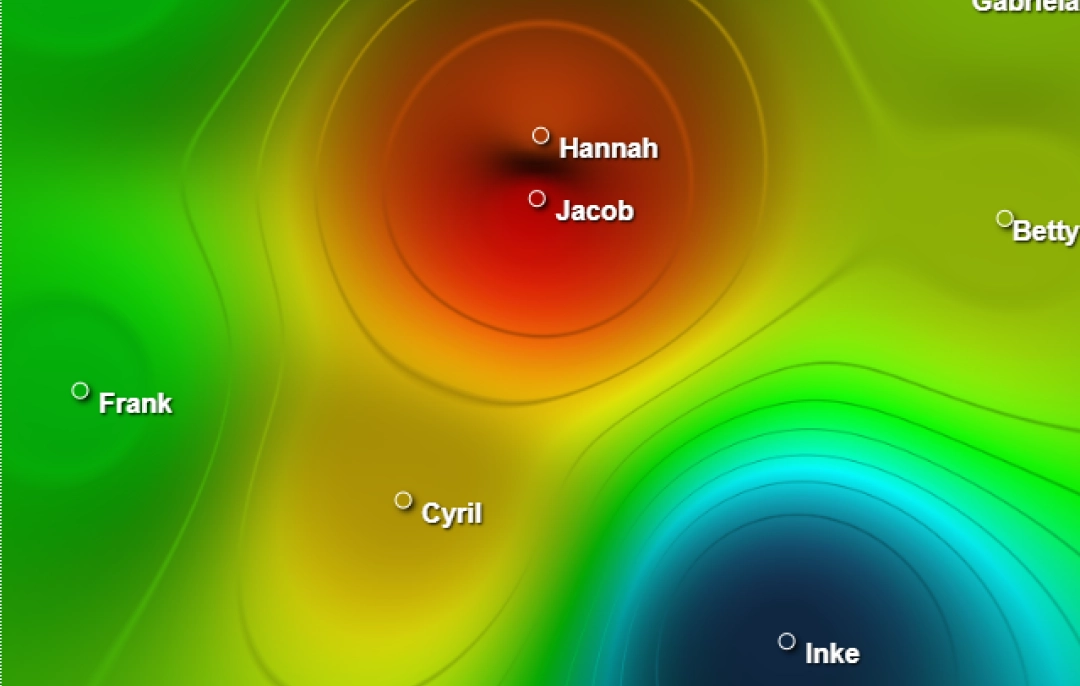
After visualizing the team members’ answers via the Sociomap (see Fig. 5 for illustration), the whole team can use it to regularly check its progress in relation to previously set goals, and/or for devising new steps within its action plan. Crucial to the Sociomap's success in team debriefings is the ease in which it can visualize dynamic development of communication and collaboration patterns over time. In this regard, Sociomaps are pretty similar to weather maps used for weather forecasting.

Fig. 5: Example of two time snapshots of communication between team members in one newly assembled remote team. The heights on the Sociomaps correspond to an average evaluation of the frequency of communication with the others. The closer the team members to each other, the higher the frequency of their communication. The Sociomap at the beginning of animation shows the team’s situation in March 2019; at the end it shows the team’s situation in August 2019. As is apparent from the transition from the first Sociomap to the second one, there was a significant increase in communication after 6 months.
Improving team composition and functioning through segmentation
Another use case for Sociomapping lies in the segmentation of team members based on certain characteristics relevant to effective team management. For example, team members can be segmented by their psychological traits, motives, values, preferences and/or performance evaluations. The Sociomap represents these multidimensional profiles of individual team members on a map, plotting similar team members closer to each other and with height coding the value of the specific characteristic (see Fig. 6 for illustration).
These visualizations enable the team leader and also the rest of the team to quickly grasp what “types'' of colleagues work in their team and how to customize their approach to individual team members. With such a Sociomap at hand they can, for example, more easily:
- Determine team deficiencies by which “types’ of people are missing.
E.g. The team can be full of creative thinkers but misses well organized and meticulous doers. - Identify and moderate potential conflicts and synergies between subgroups within the team.
E.g. people with more/less organized working styles or with more/less direct styles of communication may easily conflict. - Differentiate approach to performance and talent management based on individual team members' motives, values and preferences.
E.g. some people value leadership positions and prefer opportunities to get ahead, while others might avoid taking unnecessary risks and prefer the status quo, consistency and predictability. - Identify subgroups of employees with similar professional development needs.
E.g. there might be groups of team members with similar profiles of strengths and weaknesses based on their last 360 feedback results).


Fig. 6: Sociomaps showing psychological structure of the team. Positions of individual team members were computed based on their scores across all seven scales of Hogan Personality Inventory that measures personality characteristics important for success in careers, relationships, education, and life. The more similar are psychological profiles of team members, the closer they are on the Sociomap. Height represents percentile score on a given scale. As an example, two personality characteristics are shown here: Interpersonal Sensitivity (extent a person is seen as perceptive, tactful and socially sensitive) at the top and Sociability (extent a person needs to or enjoys interacting with others) at the bottom. These characteristics have the highest variability among the team members in this specific team. It means that in these areas there is the highest potential for occurrence of conflicts, but also synergies if the differences between individual team members will be managed well.

Sociomapping applied to passive data
The rise of modern digital collaboration platforms like email, instant messaging, online meetings, shared documents or project management tools has pushed our ability to navigate our social environment to the limit. These tools have created many new connections through which communication and collaboration can take place, and also enlarged the overall volume of collaboration activities. Nowadays it is thus very difficult for management to orient themselves within the scale of collaboration traffic in their company, make appropriate adjustments to the way employees work together, and achieve desirable improvements in employee experience and productivity.
On the flip side, the digital trails we leave behind us on these platforms can be used to measure, analyze and ideally also optimize the patterns of our communication and collaboration in terms of our well-being and productivity. If we want to feed the Sociomaps with this type of passive data, we need to deal somehow with the simple fact that many companies consist of hundreds or thousands of employees. The problem is that Sociomaps become cluttered and not very informative when the number of displayed people highly exceeds 30.
Fortunately, there is a solution to the volume problem. We can use a similar trick we often deploy when trying to boost the capacity of our short-term memory, for example when trying to memorize a friend's phone number. This trick is in cognitive psychology known as “chunking”. The APA Dictionary of Psychology defines it as “the process by which the mind divides large pieces of information into smaller units (chunks) that are easier to retain in short-term memory. As a result of this recoding, one item in memory (e.g., a keyword or key idea) can stand for multiple other items (e.g., a short list of associated points).”
Applied to the friend's phone number example mentioned above, chunking would enable us to encode a 9 digit phone number 605380941 as a set of just 3 numbers 605 380 941 instead. In the context of Sociomapping, it offers itself to group employees in a similar way by their team or department affiliation (with preserved possibility to zoom in to individual departments and/or teams, if necessary). Let’s explore some use cases for this type of Sociomap in the next two sections.
Aligning actual collaboration behavior with business goals
After feeding the Sociomapping algorithm with metadata coming from various communication and collaboration platforms, patterns emerge which accentuate how much each team collaborates and with whom they collaborate the most.
In Fig. 7 we can see that in a given month the center of collaboration gravity across three platforms (calendars, emails and Slack) was located in the Management team and Development Management team. The seven remaining teams rotate around them at various distances. The relative distances between individual teams show us that there are two main clusters of tightly cooperating teams (one around Management team and the second around Development Management team), with the Data team being somewhere in the middle. The Agency and Board teams seem to be outside the intensive collaboration traffic within this company. (To see separate Sociomaps for individual platforms, use this link to go to the Time is Ltd.’s interactive platform.)

Fig. 7: The Sociomap aggregating information about collaboration traffic within and between individual teams across three different collaboration platforms - calendars, emails and Slack. Distances between teams refer to the number of meetings teams attend together and to the number of emails and Slack messages exchanged between them. The height represents the normalized amount of collaboration activity aggregated across all three collaboration platforms. To see separate Sociomaps for individual platforms, use this link that will take you to the Time is Ltd.’s interactive platform.
With such a Sociomap at hand we can then start to ask questions and hypothesize whether or not observed patterns of collaboration are in line with the current business goals and ongoing projects agendas. For example, we might ask whether the Agency team is not too siloed to be effectively useful for marketing projects it is participating in; in the case of Management, on the other hand, we can ask whether its central position is not in conflict with the company’s current efforts to increase employee empowerment. We could also hypothesize that the Data team moves between the two major clusters of cooperation in the company so it can take feedback from the business side and apply this with its own ideas in production.
Based on additional inputs from selected employees and/or from the platforms themselves, it is possible to make changes in how the work is organized and orchestrated, to increase the chance that the set goals will be met. It is then important to track these changes over time. Development of collaboration patterns will show whether the intended changes actually took place or not (to see such tracking over time in action, use this link to go to the Time is Ltd.’s interactive platform).
Tracking and shaping effective collaboration habits
Communication and collaboration are not just a matter of quantity, but also quality. For example, in the case of meetings, it is one thing to know what teams attend meetings a lot (or not so often) and with whom (or with whom not), but another thing to know which teams use meetings effectively and which not.
Thus, we should also have some measures that will be proxies for qualitative aspects of collaboration. For example, in the context of meetings we may be interested in the degree to which employees from individual teams use meetings in line with what is known to support meetings’ productivity. We know that meetings should be smaller and shorter, that they should have an agenda, be planned sufficiently ahead of time, and take place within standard working hours. There are many similar metrics, which can be hard to digest, navigate and use for driving some action. For example, at Time is Ltd. we have put together tens of health-metrics that can be classified into four broader categories - Tool Adoption, Productivity, Collaboration and Leadership.
Fortunately, Sociomapping can help us here too. Just as it can be used for the visualization of employees’ multidimensional psychological or performance profiles, Sociomapping can be used in the very same way for visualization of teams’ multidimensional collaboration profiles. The teams that will use a given collaboration tool in a similar way will be closer to each other on the Sociomap, and the height will code the value (quality) of the specific aspect of collaboration behavior in individual teams (see Fig. 8 for illustration). This visualization enables management to quickly identify groups of teams or departments that need to improve effectiveness of their collaboration behavior.


Fig. 8: Sociomaps showing meeting habits of individual teams within the company. Positions of individual teams were computed based on their scores across 24 health-metrics that measure the degree to which individual teams use meetings in line with effective meeting habits. The more similar the collaboration profiles of teams, the closer they are on the Sociomap. Height represents the value of a given health-metric. As an example, four specific health-metrics are shown here: 1) proportion of meetings with an agenda (first from the top); 2) proportion of small meetings, i.e. meeting with less than 9 attendees (second from the top); 3) proportion of short meetings, i.e. meetings of 60 minutes or less (third from the top); 4) proportion of meetings planned sufficiently ahead of time, i.e. minimally 24 hours ahead (fourth from the top).
Data-driven collaboration management as part of the “new normal”
Over the last ten years, people management has moved pronouncedly from decisions based on personal beliefs to those that are evidence-based. No longer should management rely on their hopes, fears, experience, intuition, guesswork, or conventional wisdom - they can now rely on data-driven practices, with a much higher chance of attaining favourable organizational outcomes. This approach is also successful for areas that we once considered too "soft" and intangible to be manageable at scale via tools of evidence-based management.
Economic trends have also helped: workplace digitization and globalization, remote work, flexible work schedules, the gig economy, etc. The COVID-19 pandemic has further accelerated these developments, forcing company communication and collaboration to become much more digitally dependent. As we spend more time working on/via these platforms, we leave behind us a trail of metadata, from which we can create useful proxy measures that shed light on many aspects of our work that are important for our well-being and productivity.
But to be able to utilize this data in day-to-day business decision-making, we also need tools that will provide us with a user-friendly interface for the data. We need something analogous to the operating system we routinely use to harness the power of complex computer hardware. Sociomapping is such a kind of tool.
Get your collaboration map today
At Time is Ltd., we measure digital collaboration and productivity, without ever sacrificing employee privacy. We provide an advanced analytical SaaS platform that delivers a holistic view of an organization collaboration patterns. We measure your team’s digital footprint to improve communication, productivity as well as save precious time. Our approach only aggregates meta-data from a variety of data sources, to show how your teams work with your collaboration tools so you can get them more productive and motivated.
References
APA Dictionary of Psychology - chunking. (n.d.). Retrieved November 29, 2020, from https://dictionary.apa.org/chunking
Chunking (psychology). (n.d.). Retrieved November 29, 2020, from https://en.wikipedia.org/wiki/Chunking_(psychology)
Empowerment. (n.d.). Retrieved November 29, 2020, from https://en.wikipedia.org/wiki/Empowerment
Evolution of human intelligence. (n.d.). Retrieved November 29, 2020, from https://en.wikipedia.org/wiki/Evolution_of_human_intelligence
George Armitage Miller. (n.d.). Retrieved November 29, 2020, from https://en.wikipedia.org/wiki/George_Armitage_Miller
Hogan Personality Inventory. (n.d.). Retrieved November 29, 2020, from https://www.hoganassessments.com/assessment/hogan-personality-inventory/
Intentionality. (n.d.). Retrieved November 29, 2020, from https://en.wikipedia.org/wiki/Intentionality
Kinderman, P., Dunbar, R., & Bentall, R. P. (1998). Theory-of-mind deficits and causal attributions. British Journal of Psychology, 89, 191-204.
Metcalfe's law. (n.d.). Retrieved November 29, 2020, from https://en.wikipedia.org/wiki/Metcalfe%27s_law
Randhawa, M. (2020, February 11). What is the Difference Between Active and Passive ONA? Retrieved November 29, 2020, from https://www.myhrfuture.com/blog/2020/1/31/what-is-the-difference-between-active-and-passive-ona
Recursion. (n.d.). Retrieved November 29, 2020, from https://en.wikipedia.org/wiki/Recursion
Rezab, J. (2020, July 3). Companies Strategize Post-Coronavirus Return to Work - Many Without Data. Retrieved November 29, 2020, from https://www.timeisltd.com/post/companies-strategize-post-coronavirus-return-to-work-many-without-data
Ruffus, M. (n.d.). Metcalfe's Law and Network Effect in Shipping. Retrieved November 29, 2020, from https://www.searates.com/blog/post/metcalfs-law-and-network-effect-in-shipping
Social cognition. (n.d.). Retrieved November 29, 2020, from https://en.wikipedia.org/wiki/Social_cognition
Sociomapping. (n.d.). Retrieved November 29, 2020, from https://en.wikipedia.org/wiki/Sociomapping
Sundstrom, E., De Meuse, K. P., & Futrell, D. (1990). Work Teams. Applications and Effectiveness. American Psychologist, 45(2), 120-135.
Theory of mind. (n.d.). Retrieved November 29, 2020, from https://en.wikipedia.org/wiki/Theory_of_mind
Tuckman, B. W. (1965). Developmental sequence in small groups. Psychological Bulletin, 63(6), 384-399.
Tuckman's stages of group development. (n.d.). Retrieved November 27, 2020, from https://en.wikipedia.org/wiki/Tuckman%27s_stages_of_group_development
Whitmore, J. (1988). Coaching for Performance. Boston, MA: Nicholas Brealey Publishing.


.svg)
.svg)


